
Causes and Compensation Mechanisms of Droplet Non-Uniformity in Digital Inkjet Systems
Causes of Droplet Non-Uniformity and Compensation Mechanisms
1. Manufacturing Variations and Crosstalk Effects
Nozzle fabrication tolerances lead to droplet volume deviations (±5%), while electromagnetic crosstalk during multi-nozzle parallel operation distorts the drive signals of adjacent nozzles. Experimental results show that a 0.1 mm nozzle diameter tolerance can induce droplet velocity fluctuations of up to 15%. Such hydrodynamic instability directly results in grayscale value deviations at the pixel level.
2. Resonance Detuning Phenomena
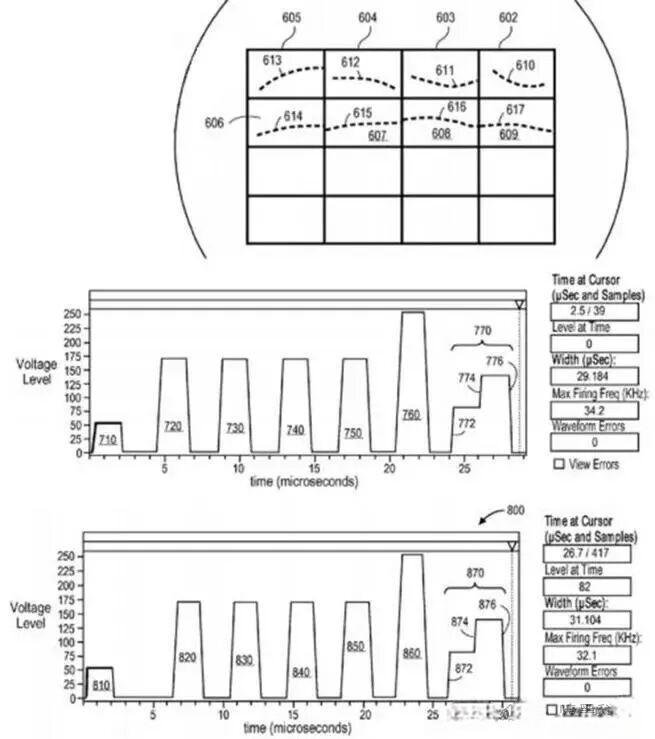
Drift in the natural frequency of piezoelectric actuators (approximately ±2 kHz) disrupts the synchronization of liquid column breakup. By monitoring droplet flight time in real time using Drop-on-Demand (DOD) techniques, resonance detuning can be detected, with the standard deviation of droplet velocity deteriorating from 0.8 m/s to 1.5 m/s.
Dynamic Compensation Implementation Pathways
| Compensation Dimension | Technical Approach | Implementation Effect |
| Energy compensation | Inserting 0.5–2 μs compensation pulses into the drive waveform | Droplet volume coefficient of variation (CV) reduced from 8.2% to 3.5% |
| Timing optimization | PID-based pulse phase adjustment (±50 ns accuracy) | Inter-droplet spacing uniformity improved by 67% |
| Resonance control | Dynamic switching to dual-slope drive modes | Velocity fluctuation range reduced to ±0.3 m/s |
Image Quality Improvement Validation
1. Optical Inspection System
A line-scan CCD operating at a 20 kHz sampling rate is used to capture droplet morphology. Compensation effectiveness is evaluated using an edge sharpness score (ESS ≥ 0.85). Measurements show that after compensation, dot roundness error decreased from 12 μm to 4 μm.
2. Color Reproduction Accuracy Testing
Under ISO 12647-2 conditions, the average ΔE2000 color difference improved from 6.3 to 2.8. In particular, the moiré suppression rate in cyan–magenta overprint regions reached 92%.
Digital Inkjet Dot Quality Analysis
A Multidimensional Evaluation Model for Digital Inkjet Dot Quality
I. Fundamental Geometric Attributes
1. Dot Density (Dots per Unit Area)
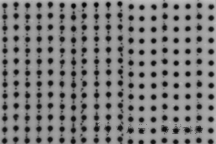
The number of ink dots per square millimeter directly determines image resolution.
A 600 dpi system corresponds to approximately 283 dots/mm². When using 3.5 pL droplets, the theoretical maximum dot density can reach 1,600 dots/mm².
By analyzing dot lattice distribution within sampled areas using ImageJ, the deviation rate between actual dot density and the theoretical value can be calculated.
2. Mean Dot Area
For an ideal circular ink dot, the area is defined as:
A=πr2A = \pi r^2A=πr2
where the radius
r=Vπhr = \sqrt{\frac{V}{\pi h}}r=πhV
V is the droplet volume and h is the ink layer thickness.
In practical measurements, individual dot pixel regions are extracted using a threshold segmentation method (Threshold = 23 ± 5). The median area of 100 sampled dots is then statistically evaluated.
For 3 pL droplets on coated paper, the standard dot area should be 785 μm² ± 5%.
3. Circularity and Aspect Ratio
- Circularity is calculated as:
Circularity=4π×AreaPerimeter\text{Circularity} = \frac{4\pi \times \text{Area}}{\text{Perimeter}}Circularity=Perimeter4π×Area
A perfect circle has a value of 1.0; in actual printing, values should be ≥ 0.85.
- Aspect ratio is defined as the ratio of the major axis to the minor axis of a dot, reflecting elliptical deformation.
High-quality dots should be controlled within 1.2:1.
These parameters can be automatically measured using the Halcon image processing system, which also generates distribution histograms.
II. Dynamic Formation Characteristics
1. Perimeter Coefficient of Variation (Perimeter CV)
The standard deviation of perimeters from 50 adjacent dots is statistically analyzed.
A CV exceeding 15% indicates jetting instability or non-uniform media absorption.
Applying Gaussian filtering (σ = 0.8) during preprocessing can effectively reduce measurement noise.
2. Dot Registration Accuracy
During multicolor overprinting, the centroid offset among C/M/Y/K dots should be less than one-quarter of the dot diameter.
Using template matching algorithms (e.g., Halcon shape-based matching), positional deviations of feature points can be detected.
Typical industrial standards require Δx, Δy ≤ 12 μm.
3. Satellite Dot Count
Secondary droplets with diameters less than one-fifth of the main dot are defined as satellite dots.
If more than 3 satellite dots per 100 main dots are observed, waveform parameters must be adjusted.
Satellite dot distribution can be clearly observed under a dark-field microscope (200×).
III. Optical Performance Parameters
1. Mean Gray Value
In an 8-bit grayscale image, the ideal gray value of a single dot is:
G=255×(1−R)G = 255 \times (1 – R)G=255×(1−R)
where R is reflectance.
Using ImageJ’s “Analyze Particles” function, the mean gray value of valid regions is measured within a threshold range of 23–28.
For solid areas, the requirement is G ≤ 15.
2. Edge Fidelity
For test lines with a designed width of 100 μm, the edge deviation is calculated as:
ΔW=1n∑i=1n∣Xactual−Xtheoretical∣\Delta W = \frac{1}{n} \sum_{i=1}^{n} \left| X_{\text{actual}} – X_{\text{theoretical}} \right|ΔW=n1i=1∑n∣Xactual−Xtheoretical∣
High-precision printing requires ΔW < 8 μm.
Three-dimensional profile verification can be performed using confocal microscopy.
IV. Quality Evaluation Matrix
| Parameter | Measurement Method | Acceptance Criterion | Influencing Factors |
| Dot density | ImageJ particle analysis | ±5% of design value | Nozzle clogging rate |
| Circularity | Halcon morphological analysis | ≥ 0.85 | Media surface energy |
| Aspect ratio | Elliptical fitting algorithm | ≤ 1.2:1 | Droplet flight stability |
| Gray uniformity | Standard deviation statistics | CV < 8% | Ink penetration consistency |
| Color registration error | Template matching | ≤ 12 μm | Mechanical transmission accuracy |