
I. Core Testing Logic: Design Essence and Advantages of 16-Level Grayscale Patches
(A) Structural Design of 16-Level Grayscale Patches
- Gradient Division Standard
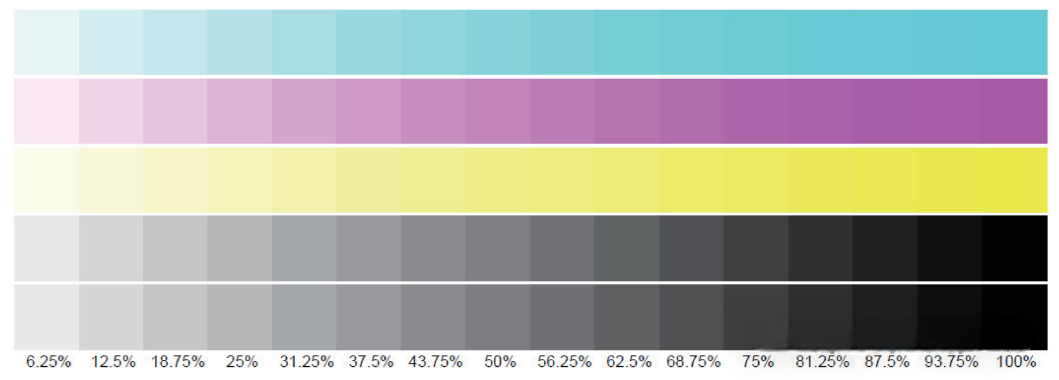
The 16-level grayscale is designed according to the principle of “uniform luminance increment,” covering the full grayscale range from 0% (pure white, no ink coverage) to 100% (pure black, maximum ink coverage). Each grayscale step theoretically differs by 6.25% (100% ÷ 16), with coverage ratios (percentage of ink coverage area) increasing incrementally from 0%, 6.25%, 12.5%, … up to 100%.
The standard size of each patch is 15mm × 15mm, with a spacing of 2mm to avoid ink bleeding between adjacent patches. The design refers to the ISO 19751-2 digital printing grayscale testing standard.
- Differences Compared with Other Grayscale Testing Tools
| Testing Tool | Number of Gradients | Core Test Objective | Advantageous Scenarios | Limitations |
| 16-Level Grayscale Patch | 16 (0%-100% full coverage) | Grayscale discernibility, density deviation from theoretical value | Routine quality control, density calibration | Gradient interval slightly wide, cannot capture subtle luminance differences |
| 256-Level Grayscale Image | 256 (0-255 grayscale values) | Smooth gradient transitions, micro-scale grayscale transitions | High-end image print calibration | Visual inspection difficult; requires professional instruments |
| Photo Area Grayscale Background | Continuous gradient (no clear division) | Visual gray balance, scene-specific grayscale performance | Comprehensive effect verification | Cannot quantify density differences |
Core Conclusion: The primary value of the 16-level grayscale patch lies in its “balance of intuitiveness and quantifiability”—it allows for rapid visual inspection while enabling precise density calibration via instruments, making it a standard module for grayscale performance testing in digital inkjet systems.
(B) Underlying Logic of Dual-Dimensional Testing
- Grayscale Variation and Discernibility
Based on the human eye’s luminance perception threshold (minimum discernible luminance difference ~3%-5%), the 6.25% interval of the 16-level gradient matches the perceptual range, enabling visual determination of whether adjacent grayscale levels can be clearly distinguished. This reflects the printer’s grayscale transition fineness. - Density vs. Theoretical Value Deviation
Each grayscale level corresponds to a fixed theoretical density (calculated as “density = coverage × maximum density,” e.g., the theoretical density of K at 100% coverage ≈1.5D). By comparing measured density with theoretical values, ink coverage uniformity and droplet control precision can be verified.
II. Core Testing Functions: From Grayscale Discernibility to Density Accuracy
(A) Function 1: Grayscale Variation and Discernibility Test (Visual Perception Dimension)
- Evaluation Criteria
- Discernibility: Adjacent grayscale levels must be clearly distinguishable without “sticking” or “stepping” (e.g., if levels 3 and 4 appear visually identical, it is deemed noncompliant).
- Continuity: The transition from pure white (level 0) to pure black (level 15) should be uniform without abrupt luminance jumps (e.g., levels 8-9 showing >6.25% difference).
- No color cast: All grayscale patches must remain neutral gray, free from red, green, or blue tint (e.g., dark gray appearing bluish, light gray reddish).
- Common Defects and Technical Causes
| Defect Type | Visual Manifestation | Core Technical Cause |
| Grayscale Sticking | 2-3 adjacent grayscale levels indistinguishable (e.g., levels 5-7 appear same) | Insufficient droplet volume control; ink coverage difference between adjacent levels <5% |
| Stepped Transition | Luminance difference between two levels significantly exceeds 6.25% (e.g., level 10 to 11 suddenly darker) | Poor grayscale algorithm optimization; abrupt CMYK overlay ratio changes; nozzle droplet output fluctuation |
| Color-Tinted Gray | Gray patches show noticeable color bias (e.g., light gray pinkish, dark gray bluish) | Imbalanced gray balance calibration (e.g., C > M+Y causing dark gray to appear blue) or ink color deviation |
Impact on Printing Quality
Grayscale discernibility directly affects “layering” and “fineness” of printed output:
- Image Printing: Poor grayscale transitions cause loss of photo tonal depth (e.g., sky gradients show banding, facial shadows appear harsh).
- Document Printing: Insufficient gray contrast between text and background reduces readability (e.g., text on light gray background appears blurry).
- Large Format Printing: Sticking in large grayscale areas produces a “blocky” effect, reducing visual sophistication.
(B) Function 2: Density vs. Theoretical Value Test for Different Coverage Patches (Quantitative Metric Dimension)
- Testing Tools and Methods
- Tool: Reflective densitometer (suitable for paper, fabric); measure 3 points per grayscale level (center + two sides) and average as the measured density.
- Theoretical Density Calculation: Based on K 100% coverage maximum density (Dmax), the theoretical density at any level = coverage × Dmax (e.g., Dmax=1.5D, 6.25% coverage → 0.09375D).
- Deviation Evaluation: Measured density deviation ≤ ±5% = excellent; ≤ ±10% = acceptable; > ±15% = abnormal density control.
- Core Technical Correlation of Density Deviations
| Grayscale Level (Coverage) | Theoretical Density (Dmax=1.5D) | Common Deviation | Technical Cause |
| Low Coverage (6.25%-25%) | 0.09-0.375D | Measured density lower than theoretical (e.g., 0.06D) | Insufficient droplet volume, poor nozzle atomization, uneven coverage |
| Medium Coverage (31.25%-62.5%) | 0.47-0.94D | Large density fluctuation (deviation >0.05D at same level) | Uneven droplet placement, material permeability differences causing local coverage variation |
| High Coverage (68.75%-100%) | 1.03-1.5D | Measured density higher than theoretical (e.g., 1.6D>1.5D) | Droplet stacking, excessive ink spread, actual coverage exceeds design |
Quantitative Impact on Printing Quality
- Low coverage deviation: light gray appears too dark or too light, affecting tonal accuracy.
- Medium coverage deviation: mid-tone areas (e.g., facial or landscape transitions) show “patchy” defects.
- High coverage deviation: pure black appears muddy (density too high) or grayish (density too low), reducing contrast and visual impact.
III. Correlation Between Test Results and Core Printer Performance
(A) Direct Link with Droplet Control Technology
- Droplet Volume Precision:
16-level grayscale relies on “incremental micro-droplet volumes” (e.g., low coverage requires 3.5 pl droplets, high coverage requires 27 pl). Droplet volume errors >10% directly cause low-coverage density insufficiency or high-coverage density overshoot. - Droplet Placement Uniformity:
Medium coverage areas are most sensitive to placement accuracy; nozzle misalignment leads to density fluctuations within the same grayscale level (“local dark/light spots”).
(B) Synergy with Color Management System
- Gray Balance Calibration:
The requirement for no color cast in 16-level grayscale depends on precise CMY overlay ratios (ideal gray: C=M=Y or fixed proportion overlay). Misalignment in gray balance parameters causes grayscale patches to deviate in hue. - Density Curve Optimization:
The printer’s density-coverage curve must match the theoretical 16-level grayscale curve. Measured deviations can be used to optimize the density curve (e.g., increasing droplets for low coverage, reducing for high coverage) for precise calibration.
(C) Compatibility with Substrate and Ink Properties
- Material Permeability:
High-permeability materials (e.g., standard paper) cause low coverage ink to spread, increasing measured density; low-permeability materials (e.g., PET film) cause droplet stacking, overshooting high coverage density. - Ink Drying Speed:
Slow drying leads to ink bleeding between adjacent grayscale patches, blurring boundaries and affecting density measurement accuracy (reflectivity unstable for wet ink).
IV. Industry Application Scenarios and Practical Optimization Pathways
(A) Routine Quality Control and Equipment Calibration
- Quick Startup Calibration:
Industrial inkjet printers print 16-level grayscale charts daily after startup, completing two core checks within 5 minutes:
- Visual: Quickly verify adjacent grayscale levels are discernible and color-neutral.
- Instrument Measurement: Focus on densities of 0% (white), 50% (mid-gray), 100% (black). If 50% mid-gray deviation > ±8%, initiate auto-calibration (adjust droplet volume and drive voltage).
- Batch Production Quality Monitoring:
For image printing, document printing, etc., sample 1 in every 100 prints for 16-level grayscale testing:
- Compare 100% black densities; fluctuation ≤ ±3% to prevent density drift from continuous operation.
- Check low coverage areas (6.25%-12.5%) for discernibility to prevent droplet insufficiency.
(B) Equipment Selection and Parameter Optimization Case Studies
- Selection Core Metrics:
When purchasing inkjet equipment, 16-level grayscale testing key points:
- Discernibility: ≥14 distinguishable levels;
- Density Deviation: ≤ ±8% for all levels;
- No Color Cast: ΔE ≤1.0 for all patches.
- Parameter Optimization Practices:
- Image Printing Company: Low coverage (6.25%) density too low (0.07-0.09D); adjusting small droplet volume from 3.5 pl → 4.0 pl and optimizing nozzle waveform reduced deviation to ±3%, improving light gray transition.
- Packaging Printing Company: High coverage (100%) density overshoot (1.65D > 1.5D) caused droplet stacking in black; reduced K ink viscosity from 20 mPa·s → 18 mPa·s and increased media speed, returning density to 1.52D, within deviation limits.
V. Key Considerations for Test Implementation
- Measurement Environment Control:
Density measurements must be conducted at standard temperature and humidity (23 ±2°C, 50 ±5% RH) to avoid high temperatures causing ink reflectivity or low humidity causing static interference. Visual inspection should be under D50 standard illumination to prevent ambient light color bias. - Sample Handling:
Wait for complete ink drying (5-30 min depending on substrate) before measuring density to avoid “wet reflectance” errors. Clean substrate surface to remove dust, fingerprints, or other interference. - Integration with Other Test Modules:
16-level grayscale testing should be combined with photo area grayscale background and color block tests:
- If grayscale has no hue deviation but photo area appears bluish, gray balance adaptation in scenario applications is insufficient, requiring adjustment of color management parameters.
- If density deviation passes but grayscale sticking occurs, insufficient resolution is likely; cross-check with line/radial test results.